
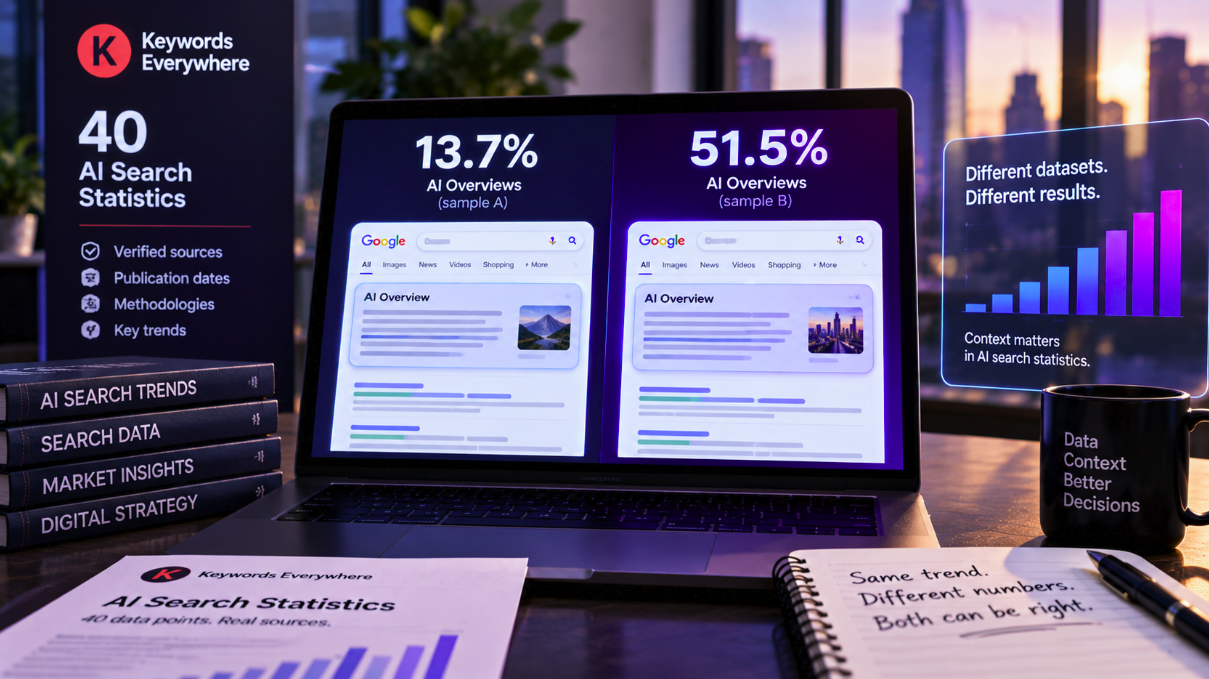
How often does Google show an AI Overview? Depending on the study you read, a defensible answer can be roughly 14% of searches—or more than half.
That spread looks like a contradiction until the datasets are examined. A new reference database from Keywords Everywhere collects 40 AI Search statistics with their sources, dates and measurement context, and its most useful lesson may be that headline percentages are often meaningless without the denominator behind them.
The Keywords Everywhere AI Search statistics database, published September 6 and checked again on September 8, is not a new primary study. It is a curated compilation that brings together measurements of AI assistant usage, referral traffic, AI Overview prevalence, click effects and citation behavior. The page explicitly names who measured each statistic and when, while distinguishing metrics that are frequently mixed together in industry discussions.
Its AI Overview section is a particularly strong illustration of why methodology matters. One study measured activation at 13.7%. Another found 51.5%. Both can be accurate descriptions of the samples they actually observed.
The same feature can have radically different prevalence in different query sets
The lowest figure in the comparison central to this discussion comes from researchers Haofei Xu, Umar Iqbal and Jacob M. Montgomery. Their 2026 study measured 55,393 trending Google queries across 19 topical categories over a 40-day period from March 13 to April 21.
The researchers found that AI Overviews appeared for 13.7% of those queries overall. Their primary preprint also reports a dramatic difference inside the same dataset: activation rose to 64.7% for question-form queries.
That single result already demonstrates the central problem. Even before comparing two research organizations, the measured prevalence can change from 13.7% to almost 65% depending on which subset of one dataset is examined.
The Keywords Everywhere compilation notes another important characteristic of the Xu, Iqbal and Montgomery sample: 51% of its Google Trends queries were sports-related. That composition matters because Google does not trigger AI Overviews uniformly across every topic and intent.
The 51.5% result measured a different search population
At the other end of the comparison, Keywords Everywhere reports a 51.5% AI Overview prevalence rate from Grossman and colleagues’ SIGIR 2026 research. The compilation describes the sample as 14,212 representative real-user queries from the ORCAS set, measured on mobile on December 7 and 8, 2025.
That is not the same experiment as sampling trending Google Trends queries months later.
The query source is different. The dates are different. The device context is specified as mobile. The intent distribution is different. The size and construction of the query set are different.
Comparing 13.7% and 51.5% as though two researchers measured the same population at the same moment is therefore misleading. They did not.
The studies are better understood as measurements of how often AI Overviews appeared under two different observational designs.
There is no single neutral basket of “Google searches”
SEO statistics often hide an uncomfortable methodological reality: researchers cannot easily observe every Google search and draw a perfectly representative global sample.
Instead, studies construct proxies.
One researcher may track millions of commercial keywords. Another may use real-user clickstream data. Another may examine enterprise websites. Another may collect trending searches. Another may focus on a specific country, device or vertical.
Each approach can answer a useful question, but it is not necessarily answering the same question.
This becomes especially important with AI Overviews because Google’s decision to generate one is strongly associated with the nature of the query. Informational questions, commercial searches, breaking news, health topics, sports queries and navigational searches can behave very differently.
As a result, “What percentage of searches show AI Overviews?” is incomplete unless it is followed by “Which searches?”
The wider range of published estimates proves the point
Keywords Everywhere’s table includes several other prevalence measurements between the two headline figures.
Semrush measured 15.69% across a broad panel of more than 10 million keywords in November 2025. Pew Research Center measured AI summaries on about 18% of real-user searches in March 2025. SISTRIX found just over 20% across a German keyword set exceeding 100 million keywords. Conductor reported 25.11% in an enterprise panel of 21.9 million queries across 13,770 domains.
Higher estimates include a 43% figure from a Similarweb U.S. clickstream panel in July 2026 and roughly 48% from BrightEdge across nine commercial verticals in March 2026. Keywords Everywhere notes that the Similarweb figure did not come with a published methodology.
These numbers do not form a clean progression toward one “correct” percentage. They describe different query universes observed at different moments.
That is precisely why putting them side by side is useful.
A 15% prevalence rate does not invalidate a 50% rate
When two SEO studies produce very different results, the industry often treats the discrepancy as evidence that one methodology must be wrong.
Sometimes that is true. Measurement errors exist. Samples can be biased, tracking systems can fail and research claims can be overstated.
But a difference alone is not proof of an error.
Imagine one dataset consisting primarily of short navigational searches and another containing detailed informational questions. If Google triggers AI Overviews far more frequently for the second group, both studies can accurately report dramatically different prevalence.
The same principle applies to geography, device, industry and time.
The correct comparison is not simply percentage versus percentage. It is population versus population, methodology versus methodology and date versus date.
Time is another hidden variable
AI Search is changing quickly enough that studies conducted months apart may capture materially different products.
Google expands and adjusts AI features continuously. A measurement from March 2025 should not automatically be compared with a July 2026 measurement as though the underlying search experience were static.
Keywords Everywhere handles this issue by attaching dates to statistics and replacing stale figures rather than indefinitely stacking old values. Its page also maintains a changelog when figures are replaced.
That approach is valuable because AI Search statistics age faster than many conventional SEO benchmarks.
A percentage without a measurement date is therefore almost as incomplete as a percentage without a sample description.
Users, prevalence and referrals are not interchangeable metrics
The database also makes a distinction that should be standard in AI Search reporting.
A user count measures how many people use a product. Prevalence measures how frequently an AI feature appears for a set of searches. Referral share measures how much outbound website traffic an AI assistant sends relative to other assistants.
These numbers can all be expressed as percentages or large audience figures, but they describe different behaviors.
For example, Keywords Everywhere lists more than 2.5 billion monthly users for Google AI Overviews based on Google’s own disclosure. That does not mean AI Overviews appear on 2.5 billion searches, nor does it tell us what percentage of queries trigger the feature.
Similarly, a high share of AI referral traffic from one assistant does not mean that assistant has the same share of AI users.
Mixing these measures can create impressive but analytically meaningless comparisons.
Question-form queries show why intent segmentation matters
The Xu, Iqbal and Montgomery study provides one of the clearest examples of the value of segmentation.
Its overall AI Overview activation rate was 13.7%, but question-form queries triggered the feature 64.7% of the time.
If a publisher’s content strategy focuses heavily on questions—how-to content, definitions, explanations or research-oriented queries—the 13.7% headline could dramatically understate its actual exposure to AI Overviews.
Conversely, a site dominated by query types that rarely trigger AI summaries could see much less exposure than a high-prevalence industry benchmark suggests.
This is why businesses should measure AI Overview prevalence across their own query portfolio rather than adopting an industry-wide percentage as a forecast.
SEO teams should build benchmarks from their own keyword universe
Industry research is useful for understanding direction, but operational decisions require a more relevant denominator.
An ecommerce retailer should track the commercial and informational searches that actually drive its category. A health publisher should monitor the health-related query set that determines its search exposure. A B2B software company should distinguish product, category, comparison and educational searches.
The goal is not to discover the universal percentage of Google searches containing AI Overviews. It is to measure how frequently AI Overviews appear for the searches that matter to the business.
That benchmark can then be tracked over time using a consistent methodology.
Consistency is often more valuable for decision-making than choosing the largest possible dataset.
Large datasets do not automatically solve sampling bias
One of the easiest mistakes in SEO research is assuming that the study with more keywords must be more representative.
A dataset of 100 million queries can still be systematically different from the search behavior a particular company cares about. Scale reduces some forms of sampling noise, but it does not automatically correct the way the sample was constructed.
If millions of keywords disproportionately represent commercial tracking terms, they answer a question about that commercial keyword universe. If thousands of queries are carefully sampled from real-user behavior, they answer another.
Neither design becomes universally representative simply because it contains a large number.
For marketers reading AI Search research, sample composition should therefore receive at least as much attention as sample size.
Methodology should travel with the statistic
The most useful practice in the Keywords Everywhere database is not any individual number. It is the attempt to keep source, date and measurement context attached to the number.
A statistic copied into a presentation often loses those qualifiers. “AI Overviews appear on 51.5% of searches” becomes a standalone claim, even though the original figure belongs to a specific query set, device context and measurement period.
After several rounds of citation, a study-specific result can become an alleged universal fact.
SEO teams can avoid that problem with a simple reporting discipline: every external benchmark should include who measured it, when, on what dataset and what exactly the metric counted.
If those details are unavailable, the number should carry less decision-making weight.
Compilation is useful precisely because it exposes disagreement
Keywords Everywhere is transparent that its page is a sourced compilation rather than a new primary research project. Its methodology page explains how its Marketing News section is sourced, maintained and corrected, while the statistics page says figures are checked and updated rather than simply accumulated forever.
That makes the database most useful as a map of the evidence rather than a new authority intended to replace the underlying studies.
The primary sources remain essential when a statistic will support a major business decision. Researchers need to understand sample construction, exclusions, collection dates and limitations that cannot always fit inside a summary table.
But a compilation can reveal something individual studies cannot: how dramatically the answer changes when the research design changes.
Both numbers can be right—and both can be wrong for your site
The difference between 13.7% and 51.5% is not an inconvenience that needs to be averaged away. It is information.
It tells marketers that AI Overview exposure is highly sensitive to the query population being measured. The correct percentage for a sports-heavy trending dataset may be very different from the correct percentage for representative mobile queries, enterprise keywords, commercial verticals or a specific publisher’s search footprint.
That makes broad claims such as “AI Overviews now appear on half of Google searches” dangerous unless the sample is named immediately afterward.
The more useful question is narrower: how often do AI Overviews appear for this defined group of searches, in this market, on this device, during this period?
Keywords Everywhere’s 40-statistic database does not resolve the AI Search measurement debate by producing one definitive number. It does something more valuable: it makes the disagreement legible.
AI Overviews can appear on roughly 14% or 52% of searches and both measurements can be correct. The mistake begins when a study-specific percentage is stripped of its dataset and presented as the state of Google Search everywhere.