
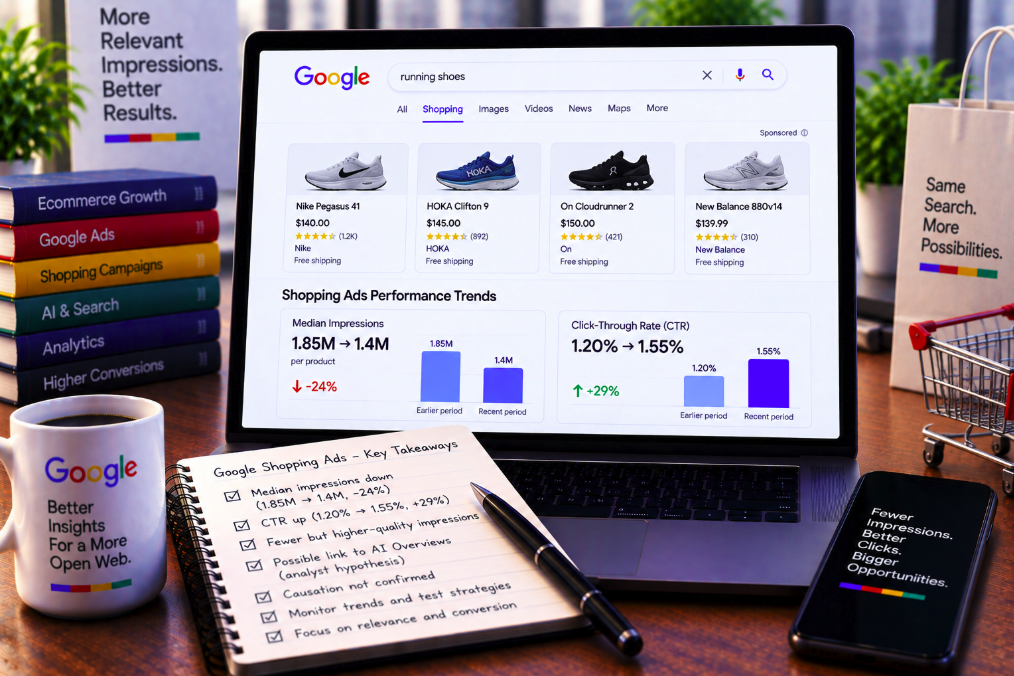
Google Shopping ads appear to be experiencing the mirror image of one of the most discussed trends in organic search: impressions are falling while click-through rates are rising.
New benchmark data shared by Mike Ryan of Smarter Ecommerce and reported by Search Engine Roundtable covers roughly 175 billion impressions. Between mid-2025 and mid-2026, median Shopping ad impressions reportedly declined from about 1.85 million to 1.4 million, while median CTR climbed from 1.20% to nearly 1.55%.
Barry Schwartz dubbed the pattern a “reverse crocodile effect,” contrasting it with the organic-search “crocodile effect” or great decoupling associated with AI Overviews, where visibility can rise while outbound clicks fall.
The Shopping pattern is real in the reported dataset. The proposed explanation is not yet established. Ryan's theory is that AI Overviews may be changing which queries generate Shopping ad impressions, effectively removing lower-click-probability searches from the denominator and leaving ads concentrated on queries with stronger click propensity. Google has not confirmed that mechanism.
Median Shopping impressions fell from roughly 1.85 million to 1.4 million
The first half of the pattern is declining reach.
According to the analysis, median Shopping ad impressions per account moved from approximately 1.85 million in mid-2025 to around 1.4 million in mid-2026.
That is a substantial change in the typical impression volume represented by the sample.
Because the reported metric is a median rather than the total number of impressions, it describes how the middle account in the distribution changed rather than simply reflecting the largest advertisers in the dataset.
CTR moved in the opposite direction
While impressions declined, median click-through rate rose from roughly 1.20% to almost 1.55%.
That divergence is what creates the visual “reverse crocodile” pattern: one line trends downward while the other moves upward.
At first glance, a higher CTR can look like a straightforward advertising improvement. More people who see the ad are clicking it.
But CTR is a ratio, and ratios can improve because the numerator gets better, because the denominator gets smaller, or because both things happen simultaneously.
A higher CTR does not necessarily mean more clicks
This is the most important analytical point for advertisers.
If an ad receives 1,000 impressions and 12 clicks, its CTR is 1.2%. If lower-intent impressions disappear and the ad receives 700 impressions with 11 clicks, its CTR rises to about 1.57% even though absolute clicks decline.
The campaign did not necessarily become more persuasive. It may simply have been shown to a smaller, more click-prone audience.
That is why CTR cannot be interpreted independently from impression and click volume.
The dataset is large, but size does not establish causality
Roughly 175 billion impressions is a substantial observational dataset.
Secondary reporting describes the analysis as spanning thousands of Shopping and Performance Max campaigns across hundreds of advertiser accounts, giving the trend more weight than a handful of anecdotal screenshots.
However, a large sample does not by itself prove why the change occurred.
The data shows a relationship over time: Shopping impressions fell while CTR rose during a period in which AI Overviews expanded. Establishing that AI Overviews caused the shift requires a different level of evidence.
Ryan's AI Overview explanation is explicitly a hypothesis
Ryan proposed that Google may consider predicted click probability when deciding where AI Overviews are more likely to appear.
Under that theory, lower-click-probability queries could be more likely to receive an AI Overview experience, while Shopping ads remain concentrated on queries with stronger commercial or click intent.
The result would be a form of selection or pruning. Shopping ads would lose impressions disproportionately from the low-CTR end of the query distribution, mechanically lifting the average CTR of the impressions that remain.
It is a plausible mechanism, but it remains an analyst's interpretation rather than a confirmed Google system description.
Google has not confirmed that it uses AI Overviews to protect ad revenue
The hypothesis can easily be overstated into a much stronger claim: that Google deliberately routes low-value queries into AI Overviews to preserve advertising revenue.
The evidence currently available does not support stating that as fact.
Search Engine Roundtable presents Ryan's explanation as his theory, and Search Engine Land's coverage likewise says AI Overviews may be affecting Shopping impressions and CTR.
Until Google publishes relevant auction or experiment data, the causal interpretation should remain clearly labeled as a hypothesis.
Several other variables could influence the same metrics
Shopping-ad performance does not exist in a controlled laboratory.
Over a twelve-month period, impression volume and CTR can be affected by advertiser budgets, bidding strategies, query demand, product mix, competition, Performance Max behavior, campaign eligibility, feed quality, seasonal shifts, device mix, ad formats and broader changes to the Google results page.
Any of those factors can change which auctions an advertiser enters and which impressions survive.
A credible causal study would need to isolate AI Overview exposure from those competing explanations.
The denominator effect can make performance dashboards look healthier
CTR is one of the easiest metrics to celebrate because its direction is intuitive: higher seems better.
But when reach contracts, the remaining audience can become more selective.
This creates a reporting trap. A campaign dashboard can show a stronger CTR while the business receives the same number of clicks, fewer clicks or less total revenue.
Advertisers should therefore treat rising CTR alongside falling impressions as a prompt for decomposition, not an automatic win.
Absolute click volume is the next metric to inspect
The first question after seeing this pattern should be simple: what happened to clicks?
If impressions fall sharply and CTR rises enough to offset the decline, click volume can remain stable. If CTR does not rise enough, clicks fall. If the remaining impressions are dramatically more productive, clicks could even increase.
The ratio alone cannot answer that question.
Campaign analysis should place impressions, CTR and clicks next to one another before drawing conclusions about performance.
Conversion volume matters more than CTR for most retailers
A Shopping advertiser ultimately needs profitable transactions, not aesthetically pleasing click-through rates.
If the remaining impressions represent stronger purchase intent, conversion rate could improve as well as CTR. In that case, fewer impressions might still generate similar or better revenue efficiency.
Conversely, if the campaign loses valuable discovery traffic, a higher CTR could coexist with lower conversion volume and slower customer acquisition.
The business outcome has to be measured downstream.
ROAS can improve while growth slows
The same denominator logic can affect return on ad spend.
When a system concentrates delivery on the easiest-to-convert demand, efficiency metrics can improve because marginal, lower-probability auctions disappear.
That can produce stronger ROAS while reducing the total number of customers reached.
For retailers optimizing for profitable growth, efficiency and scale should therefore be reported separately rather than compressed into one success metric.
The pattern could represent query-mix compression
One useful way to interpret Ryan's theory is as a change in query mix.
Shopping ads historically appear across searches with different levels of commercial intent. Some users are ready to compare products and prices, while others are still learning about a category.
If AI Overviews increasingly satisfy informational or exploratory queries without generating a Shopping impression, the remaining ad inventory would naturally skew toward users closer to a product decision.
That would make the average Shopping impression more valuable even as the total pool shrinks.
This would be the opposite of organic search's great decoupling
The “crocodile effect” metaphor became popular because publishers began reporting an expanding gap between organic impressions and clicks.
AI-generated answers can create additional Search visibility while satisfying some users without an external click, allowing impressions to remain high or rise as traffic falls.
The Shopping pattern described by Ryan reverses the geometry: impression opportunity contracts while the probability of a click on the remaining opportunity increases.
The two phenomena may occur on the same results ecosystem without having the same underlying mechanism.
Organic and paid visibility should not be analyzed independently
AI Overviews, Shopping ads, standard text ads, organic results and other SERP features compete for the same finite screen and user attention.
A change in one surface can alter the context in which another surface is served or clicked.
For ecommerce brands, this makes channel-silo reporting increasingly incomplete.
SEO and paid-search teams should compare changes in organic impressions, paid impressions, clicks, product demand and conversion behavior across the same query families where possible.
Advertisers should segment by query intent
If the hypothesis is correct, the aggregate Shopping trend should not be uniform across all searches.
Highly transactional product queries may retain or gain ad exposure, while informational category questions could lose more impressions as AI experiences expand.
That makes intent segmentation one of the most useful ways to investigate the pattern inside an advertiser's own data.
Brand versus non-brand, exact product versus category, and high-commercial-intent versus exploratory searches can reveal whether the impression decline is concentrated in particular parts of the funnel.
Performance Max complicates the analysis
Shopping inventory is increasingly intertwined with Performance Max rather than isolated inside traditional Shopping campaign structures.
Performance Max can distribute ads across multiple Google surfaces and uses automated bidding and targeting systems that change delivery dynamically.
That means changes observed in Shopping impressions can reflect more than a simple decision about whether to show a product ad for a search query.
Campaign-type mix and automation behavior need to be considered before attributing a trend to AI Overviews.
Impression share can provide additional context
When impressions fall, advertisers should ask whether the market opportunity shrank or whether their campaigns captured less of it.
Impression-share metrics can help separate some of those scenarios.
If eligible impression opportunity remains healthy but a campaign loses share because of budget or rank, the explanation is very different from a structural decline in the number of relevant Shopping auctions.
No single metric provides a complete causal answer, but triangulation is better than reading CTR alone.
CPC trends can reveal whether the remaining auctions are more competitive
If Shopping impressions become concentrated on higher-intent searches, advertisers may also face stronger competition for those auctions.
That could push cost per click upward even while CTR improves.
A retailer could therefore receive fewer, more qualified impressions but pay more for each resulting click.
CTR improvement only becomes commercially meaningful when evaluated alongside CPC, conversion rate, revenue and margin.
AI-native shopping formats could change the pattern again
Ryan suggested that the current divergence could be transitional rather than permanent.
His theory anticipates a shift from “either/or” experiences—AI answer or Shopping ad—toward “both/and” experiences in which commercial formats are integrated more directly into AI-driven results.
If Google expands shopping and advertising experiences inside AI surfaces, impression volume could behave differently again.
That possibility is another reason advertisers should avoid treating the mid-2025-to-mid-2026 trend as a permanent benchmark.
Historical CTR benchmarks may need more context
A campaign manager comparing 2026 CTR with a 2024 benchmark may conclude that creative, bidding or feed optimization produced a major improvement.
If the underlying auction mix has changed, part of that improvement may come from the environment rather than the advertiser.
Benchmarks should therefore be dated and accompanied by impression-volume context.
A 1.5% CTR in a narrower, higher-intent impression pool is not necessarily equivalent to a 1.5% CTR when the campaign was exposed across a broader range of searches.
Feed optimization still matters even if the environment is changing
Structural shifts in Search do not make ordinary Shopping optimization irrelevant.
Product titles, attributes, images, pricing, availability, landing-page quality and Merchant Center data still affect eligibility and competitiveness.
The analytical challenge is separating gains caused by better execution from gains caused by a changing impression pool.
Controlled experiments and product-level comparisons can help identify which improvements are genuinely attributable to advertiser actions.
The 175-billion-impression figure should not create false precision
A very large dataset can make a chart feel definitive.
It strengthens confidence that the observed aggregate pattern is not simply noise within one small account, but it does not reveal every detail needed to generalize the result to every advertiser.
The public reporting does not provide a full experimental design that isolates geography, vertical, campaign type, budget strategy, account composition and AI Overview exposure.
The appropriate conclusion is that the trend deserves serious attention, not that every Shopping account should expect exactly the same percentage changes.
The safest KPI framework separates reach, engagement and business impact
Advertisers can avoid the reverse-crocodile reporting trap by separating three layers of measurement.
Reach includes impressions, eligible auction volume and impression share. Engagement includes clicks and CTR. Business impact includes conversions, revenue, profit, customer acquisition and return on ad spend.
A change in one layer should be interpreted through the others.
Higher engagement efficiency is useful, but it cannot compensate for lost reach if the business ultimately acquires fewer profitable customers.
The data shows a divergence; the cause remains open
The Smarter Ecommerce analysis presents a striking paid-search pattern: across a dataset reported at roughly 175 billion impressions, median Shopping ad impressions declined from about 1.85 million to 1.4 million while median CTR rose from 1.20% to nearly 1.55% between mid-2025 and mid-2026.
Calling that a “reverse crocodile effect” is a useful way to visualize the divergence. Saying AI Overviews caused it would go beyond the evidence currently available.
Ryan's selection hypothesis is plausible: if lower-click-probability searches increasingly receive AI Overviews while Shopping ads concentrate on higher-intent queries, CTR would rise partly because the denominator is being pruned. But Google has not confirmed that mechanism, and multiple other changes could contribute to the same result.
For advertisers, the actionable lesson does not require solving the causal puzzle first. When Shopping CTR rises while impressions fall, do not celebrate the ratio in isolation. Measure the disappearing reach, count the actual clicks, follow them through conversion and revenue, and determine whether the campaign is becoming genuinely more productive—or merely more selective.