
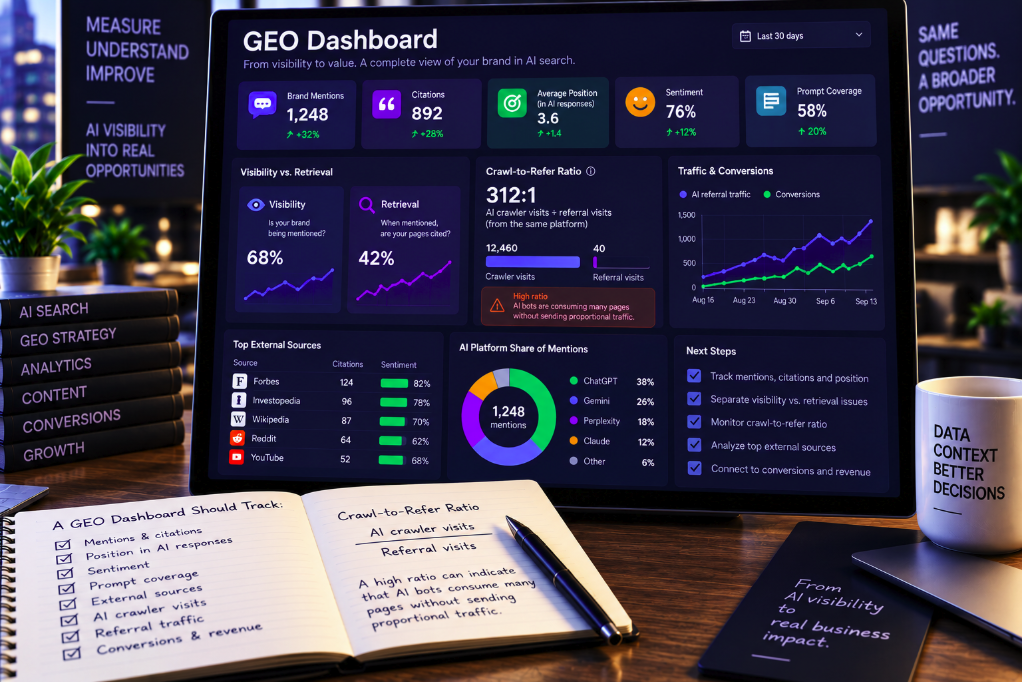
AI search reporting has a measurement problem that a single “visibility score” cannot solve. A brand can be mentioned frequently without being cited, cited without receiving a click, crawled thousands of times without seeing proportional referral traffic, or receive a small number of AI visits that convert unusually well. Putting all of those signals into one blended score hides the differences that actually tell a team what to fix.
A new Search Engine Land guide to building an AI visibility dashboard argues for a more operational model. The dashboard should connect mentions, citations, answer position, sentiment, prompt coverage and source mix with crawler logs, referral traffic, conversions and revenue. The goal is not perfect attribution, which remains impossible, but a reporting layer that separates different failure modes and connects AI exposure to measurable business outcomes.
One metric deserves particular attention: the crawl-to-refer ratio. It compares how often an AI platform’s crawler accesses a site with how many referral visits the same AI ecosystem sends back. For publishers and content-heavy businesses, it creates a simple way to see when machine consumption and human traffic are moving in very different directions.
The crawl-to-refer ratio is simple by design
The formula proposed in the guide is straightforward: AI crawler visits divided by AI referral visits equals the crawl-to-refer ratio.
If an AI crawler makes 10,000 visits to a site during a month and the associated AI ecosystem sends 100 referral visits, the ratio is 100:1. In plain language, the site received 100 crawler visits for every measurable referral visit.
The value of the metric is not mathematical sophistication. It is that it places two datasets that are usually reported separately—server-log crawler activity and human referral traffic—next to each other.
A rising crawler count accompanied by flat referral traffic is a different business condition from rising crawls accompanied by rising referrals. Traditional web analytics sees only the second half of that relationship.
A high ratio does not automatically mean an AI crawler is bad
The ratio is easy to misinterpret.
Search Engine Land explicitly warns that a high crawl-to-refer ratio does not prove the crawler is harmful. Crawling can support discovery, indexing, model grounding, search features or later retrieval. The metric shows an imbalance between observed machine access and measurable traffic; it does not establish what every crawl request was used for.
There is also no universal threshold at which a ratio becomes “good” or “bad.” A news publisher, ecommerce catalog, SaaS documentation library and corporate marketing site have different content economics and different reasons for allowing automated access.
The useful comparison is usually longitudinal: is the ratio for a particular ecosystem changing, and is that change consistent with the value the site expects from allowing access?
Do not blindly divide every AI bot by every AI referral
Implementation requires more care than the formula suggests.
AI companies can operate multiple crawlers for different purposes. Some may support search, some model training, some user-triggered retrieval and some other product functions. A referral hostname visible in analytics does not necessarily map one-to-one to every crawler carrying the same company’s name.
For that reason, teams should build platform or ecosystem mappings only when the relationship is defensible. Combining unrelated crawler traffic into one numerator and unrelated AI referrals into one denominator can produce a precise-looking ratio that has little analytical meaning.
Time windows also need to match. Monthly crawl activity should be compared with monthly referrals, using consistent timezone and bot-classification rules.
Referral data is an incomplete denominator
The denominator has its own blind spots.
Google Analytics 4 can identify some visits from AI assistants, and Search Engine Land notes that GA4 now includes an AI Assistant default channel for recognized chatbot referrers. But recognizable referral traffic is only the portion of AI discovery that arrives with enough metadata to be classified.
A user can read an AI answer that cites a publisher without clicking. Another can discover a brand in ChatGPT and return later through a branded Google search. A third can copy a URL, use a mobile app that does not preserve the expected referrer, or navigate directly.
Those journeys can create real influence without appearing as AI referrals.
The crawl-to-refer ratio therefore measures observed crawler activity against observed referral traffic, not total machine consumption against total human influence.
Zero or near-zero referrals require special handling
A ratio becomes unstable when the denominator approaches zero.
If an AI crawler makes 20,000 requests and analytics records one referral, the ratio is 20,000:1. If no referrals are detected, ordinary division is undefined rather than infinite in a useful reporting sense.
A production dashboard should flag those cases separately instead of forcing them into a normal scale. “20,000 crawls / 0 measurable referrals” communicates the condition more clearly than an artificial numerical value.
This is particularly important when comparing platforms, because one missing referrer or classification error can radically change a low-volume denominator.
The ratio belongs in the technical layer, not the executive headline
Crawl-to-refer is a diagnostic metric rather than a complete measure of AI performance.
A high ratio tells the technical or content team to investigate whether crawler activity is growing without a corresponding increase in measurable visits. It can also surface server-load concerns, unusually heavily crawled content sections or a reason to review robots.txt and AI crawler policies.
It does not tell an executive whether AI search is creating revenue.
That requires a separate business-impact layer containing conversions, qualified leads, pipeline, purchases or other outcomes.
The strongest GEO dashboard therefore keeps machine access and economic value connected but distinct.
Visibility is the first layer: does the brand appear?
Search Engine Land makes another distinction that is more useful than many composite AI visibility scores.
A visibility problem exists when an AI system does not mention the brand for prompts where the brand reasonably expects to compete.
Useful metrics at this layer include mention frequency, share of voice, answer position, sentiment and prompt or topic coverage.
A brand might perform well on branded prompts but disappear from category-discovery questions. Or it might be mentioned regularly but only near the bottom of recommendation lists.
Those are visibility questions. They concern whether the brand enters the generated answer and how it is represented once it does.
Retrieval is a different problem: what evidence does the AI use?
A brand can have strong visibility and weak retrieval at the same time.
Imagine an AI assistant recommending a software company but citing a review site, an outdated comparison page and a competitor’s article rather than the company’s current documentation.
The brand is visible. Its preferred sources are not.
Search Engine Land defines this as a retrieval problem: the AI mentions the brand but relies on third-party sources, competitors, outdated URLs or weak summaries instead of the content the brand would prefer to support the answer.
That diagnosis calls for a different response from a pure visibility gap.
Visibility and retrieval require different interventions
If the brand is absent from important prompts, the team may need broader topical coverage, stronger authority, digital PR, reviews, comparison content or better alignment with the questions buyers actually ask.
If the brand is present but the wrong sources are being retrieved, the work moves closer to technical and content architecture: clearer page structure, stronger entity signals, better internal linking, fresher content, improved structured data, stronger source credibility and more direct answers to the relevant questions.
Combining these situations into one score makes prioritization harder.
A dashboard should tell the team whether it needs to earn inclusion in the answer set or improve the evidence layer behind an inclusion it already has.
Citations are not the same as mentions
This distinction sounds obvious but is frequently lost in GEO reporting.
An AI system can name a brand without citing its website. It can cite a brand’s article while recommending a competitor. It can mention and cite the brand but send no measurable traffic.
Each event describes a different part of the system.
Mentions measure presence in the generated answer. Citations identify the source URLs the model exposes as supporting evidence. Answer position indicates prominence. Sentiment captures how the brand is described.
None should automatically substitute for the others.
Prompt coverage is the denominator visibility metrics need
A raw count of 500 brand mentions is difficult to interpret without knowing which prompts were monitored.
Prompt coverage asks where those mentions occur. Does the brand appear for product comparisons, category discovery, troubleshooting, alternatives, commercial research or only explicit branded questions?
This makes the prompt set one of the most consequential design choices in an AI visibility dashboard.
A panel overloaded with easy branded prompts can make visibility look excellent while concealing absence from commercially important discovery questions.
Prompt groups should therefore be labeled by topic, market, language and intent, and kept sufficiently stable to support trend comparisons.
Answer position adds quality to visibility volume
Being named first as the recommended provider is not equivalent to appearing in a caveat near the end of a long response.
Where tooling makes it possible, answer position gives a rough indication of visibility quality.
This metric is inherently less standardized than a traditional search ranking. AI systems can produce paragraphs, tables, lists and conversational comparisons whose structure changes between runs.
Position should therefore be interpreted within a platform and response format rather than treated as a universal rank.
Its role is to add context to mention frequency, not recreate a ten-blue-links leaderboard inside generative answers.
Sentiment detects reputation problems that citation counts miss
A dashboard showing growing mentions can look positive while the underlying answers become less favorable.
Sentiment tracking helps identify whether the brand is being described positively, neutrally or negatively, and whether recurring narratives are changing.
For reputation-sensitive categories, this can be more important than raw visibility.
A company mentioned frequently as “the expensive option with poor support” is visible but has a different problem from a company that is simply absent.
Sentiment analysis is imperfect and should be checked against the underlying answers, but it creates an alerting layer that traffic metrics cannot provide.
Source mix shows who controls the evidence around the brand
AI systems frequently rely on sources a brand does not own: publishers, review sites, forums, marketplaces, documentation, communities and competitor pages.
Tracking source mix shows whether the information environment around important prompts is dominated by first-party content or external sources.
This can reveal why editing a corporate webpage produces no visible change. If the model consistently retrieves third-party comparisons, the practical optimization surface may sit outside the brand’s domain.
A useful source table should therefore classify cited URLs by source type and ownership, not merely count domains.
External-source visibility can be valuable even without an owned citation
Third-party citations are not automatically failures.
A trusted publisher or review site recommending the brand can create credibility that a self-authored product page cannot reproduce.
The dashboard should distinguish harmful retrieval—obsolete, inaccurate or competitor-controlled evidence—from beneficial external validation.
This is why a simple “percentage of citations to our domain” KPI can mislead.
The goal is not necessarily to replace every third-party source. It is to understand which sources shape the answer and whether they represent the brand accurately.
Referral traffic is the bridge from AI visibility to human behavior
When an AI platform does send identifiable traffic, the dashboard should capture more than sessions.
Search Engine Land recommends tracking engaged sessions, landing pages, conversions, conversion rates, new versus returning users and, where available, revenue or pipeline influenced by AI referrals.
AI traffic may enter through pages that were not built as acquisition landing pages: documentation, glossary entries, help centers, research reports or comparison content.
That creates a conversion-design opportunity.
A page that AI systems like to cite may need a clearer next step for the humans who eventually arrive there.
Conversions keep the dashboard from becoming a GEO vanity report
Visibility metrics are attractive because they move quickly. Revenue moves slowly and is harder to attribute.
That makes it tempting to optimize for the metrics easiest to observe: more mentions, more citations, better share of voice.
A serious dashboard still needs a business-impact layer.
AI referral conversion rate, assisted conversions, qualified leads, pipeline and revenue should sit alongside visibility measures so teams can see whether exposure is translating into economic value.
Low traffic does not necessarily mean low value. A small number of high-intent AI visitors can outperform a much larger low-intent audience.
Assisted conversions matter because AI discovery can vanish from attribution
Last-click reporting is especially weak for AI search.
A user may discover a company in an assistant, then return later through direct traffic, branded search, email or paid search. GA4 may credit the later channel even though the AI interaction initiated the journey.
Search Engine Land explicitly warns that some AI-influenced journeys will never be perfectly attributed.
The purpose of assisted-conversion reporting is therefore not to manufacture certainty. It is to preserve evidence that AI exposure may contribute upstream even when the final session arrives elsewhere.
CRM data, customer surveys and branded-demand trends can complement referral analytics, provided teams clearly distinguish observed attribution from inference.
Server logs are the missing half of most AI dashboards
Web analytics is designed around human sessions. AI crawler behavior lives in server logs.
Those logs can show which known bots request the site, how often they arrive, which sections they crawl and whether requests receive successful responses.
That information is essential for crawl-to-refer reporting and for diagnosing access problems.
If a site has no AI mentions and its important pages are never requested by relevant crawlers, the problem looks different from a site that is crawled heavily but rarely cited.
Logs do not reveal the full internal retrieval pipeline, but they provide first-party evidence that a machine requested a resource.
Crawler identification needs maintenance
Bot reporting is not a set-and-forget task.
User agents change, new crawlers appear and spoofing is possible. Teams should use documented crawler identities and, where practical, verify network information rather than trusting every request that contains a recognizable AI name.
The classification taxonomy should also distinguish crawler purpose when documentation allows it.
Without that discipline, the crawl-to-refer ratio can drift because the numerator changes definition rather than because platform behavior actually changed.
A dashboard is only as reliable as the identity rules feeding it.
Standardize the data before visualizing it
Search Engine Land recommends combining information from GA4, server logs, AI visibility platforms, SEO tools, Search Console and CRM or conversion systems.
Those systems do not naturally share the same schema.
At minimum, a custom reporting layer should standardize date, market, language, AI platform, prompt or topic, brand, competitor, URL, source type, metric name and metric value.
This may sound like data housekeeping, but it is what makes month-over-month comparisons possible.
If “ChatGPT,” “OpenAI,” “chatgpt.com” and one crawler user agent are all treated inconsistently, the resulting dashboard can generate false trends.
The dashboard should answer what changed, why and what to do next
A good GEO dashboard is not a museum of charts.
Search Engine Land proposes organizing it around practical views: an executive overview, content performance, competitor visibility, technical monitoring and business impact.
The executive view can show referral traffic, share of voice, citations, competitor visibility and assisted conversions. Content reporting can connect cited pages with referral pages, crawl activity and prompt gaps. Technical monitoring can show crawler volume, crawl-to-refer ratio, blocked bots and server responses. Business impact can connect AI referrals to conversions, pipeline and revenue.
Each layer should lead to a decision.
Do not collapse everything into one proprietary score
A composite score can be useful for quick trend reporting, but it can also conceal the mechanism behind a change.
If the score falls, did the brand disappear from answers? Did sentiment worsen? Did citations move to third parties? Did the crawler stop accessing the site? Did referrals fall while visibility stayed flat?
Those conditions require different actions.
For operational use, the underlying components should remain visible even when executives receive a simplified summary.
The dashboard earns its value when it reduces diagnostic ambiguity.
The crawl-to-refer ratio is a diagnostic, not an ROI formula
The most provocative metric in the framework is also the one that needs the strongest guardrails.
A ratio of 1,000 crawls for every referral does not mean the platform extracted 1,000 pages to create one visit. It does not prove those specific crawls generated the answers that produced the referral. It does not quantify licensing value, brand influence or downstream conversions.
It tells you that, within a defined period and mapping, measured machine access is large relative to measured human referrals.
That is enough to justify investigation.
Publishers can use it to monitor whether their content-access policy still matches their economic goals. Technical teams can use it to detect crawl waste. Marketing teams can compare it with citation and conversion trends.
But it should never be presented as a causal exchange rate between content consumption and traffic.
There is no universal “healthy” GEO dashboard benchmark
The Search Engine Land guide is an operating framework, not an empirical study establishing industry thresholds.
It does not prove that a particular mention rate causes revenue, that a certain citation share is optimal or that a crawl-to-refer ratio above a fixed number is unacceptable.
Businesses should establish their own baselines and watch direction, consistency and economic outcomes.
A documentation site may tolerate heavy crawler activity because citations support product adoption. A subscription publisher may place much more value on referral traffic. An ecommerce business may care primarily about whether AI discovery creates purchases.
The same ratio can imply different decisions depending on the business model.
The most useful GEO dashboard separates three questions
AI search reporting becomes clearer when it is organized around three layers.
First: visibility. Does the AI mention the brand, where does it place it, how does it describe it and for which prompts?
Second: retrieval. Which sources and URLs support the answer, is the brand’s preferred content being retrieved, and are crawlers accessing the relevant pages?
Third: value. Does any of that activity produce referral traffic, conversions, pipeline or revenue?
The crawl-to-refer ratio sits between retrieval and value. It shows how much observed machine access occurs relative to measurable human traffic, while reminding teams that the two are not the same thing.
That separation is the strongest idea in the framework. GEO does not need another score that says visibility is “72.” It needs diagnostics that explain whether the brand is absent, whether the wrong evidence is winning, whether machines are consuming content without proportional referrals and whether the resulting discovery creates economic value.
Once those questions are separated, an AI visibility dashboard stops being a collection of experimental metrics and starts becoming an operating system for decisions.